


Next: Band dispersion
Up: User's manual of OpenMX
Previous: Initial velocity
Contents
Index
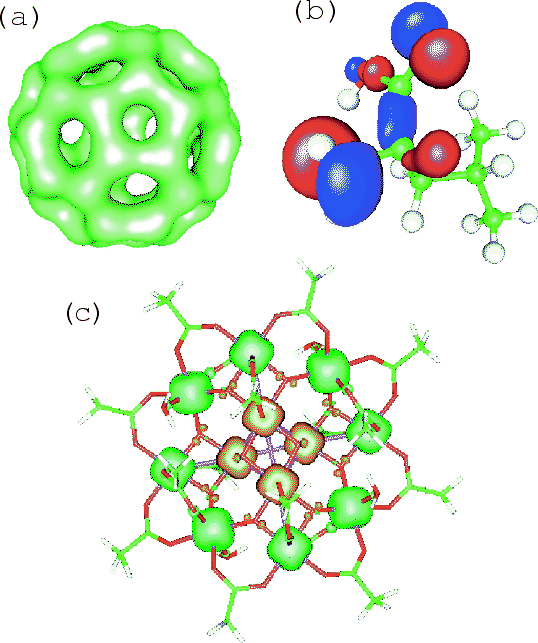
The electron densities, molecular orbitals, and potentials are output
to files in a Gaussian cube format. Figure 11 shows examples
of isosurface maps visualized by using gOpenMol [48].
These data are output in a form of the Gaussian cube. So, many softwares,
such as gOpenMol [48], Molekel [49],
and XCrysDen [50], can be used for the visualization.
You can find the details of files output in the cube format in
the Section 'Output files'. It should be noted that current gOpenMol
does not support a cube file of orthorhombic cell, while XCrysDen
supports any cube file of both orthogonal and orthorhombic cells.
Figure:
(a) Isosurface map of the total electron density of a C molecule
where 0.13 was used as an isovalue of total electron density.
(b) Isosurface map of the highest occupied molecular orbital (HOMO)
of a L-leucine molecule
where
molecule
where 0.13 was used as an isovalue of total electron density.
(b) Isosurface map of the highest occupied molecular orbital (HOMO)
of a L-leucine molecule
where  was used as an isovalue of the molecular orbital.
(b) Isosurface map of the spin electron density of a molecular magnet
(Mn
was used as an isovalue of the molecular orbital.
(b) Isosurface map of the spin electron density of a molecular magnet
(Mn O(CH
O(CH COO)
COO) (H
(H O)
O) [51])
where
[51])
where  was used as an isovalue of the spin electron density.
 |
Next: Band dispersion
Up: User's manual of OpenMX
Previous: Initial velocity
Contents
Index
2009-08-28