


Next: Band dispersion
Up: User's manual of OpenMX
Previous: User definition of atomic
Contents
Index
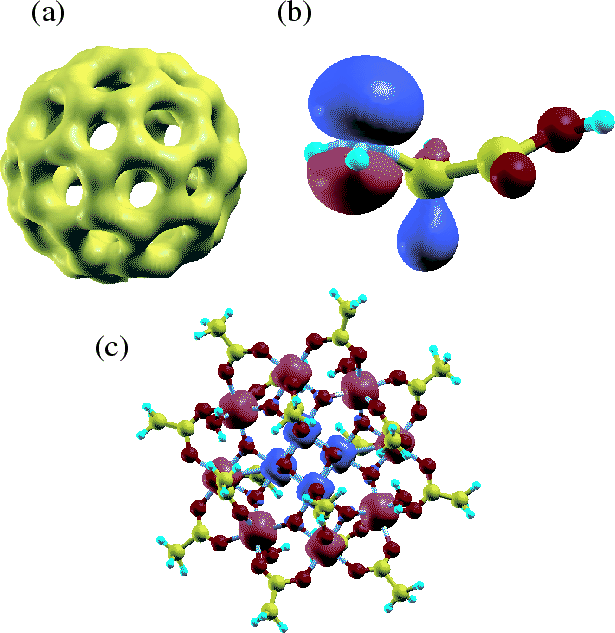
The electron densities, molecular orbitals, and potentials are output
to files in a Gaussian cube format. Figure 11 shows examples
of isosurface maps visualized by XCrySDen [56].
These data are output in a form of the Gaussian cube. So, many softwares,
such as Molekel [55] and XCrySDen [56],
can be used for the visualization.
One can find the details of output files in the cube format in
the Section 'Output files'.
Figure:
(a) Isosurface map of the total electron density of a C molecule
where 0.13 was used as isovalue of total electron density.
(b) Isosurface map of the highest occupied molecular orbital (HOMO)
of a glycine molecule
where
molecule
where 0.13 was used as isovalue of total electron density.
(b) Isosurface map of the highest occupied molecular orbital (HOMO)
of a glycine molecule
where  was used as isovalue of the molecular orbital.
(b) Isosurface map of the spin electron density of a molecular magnet
(Mn
was used as isovalue of the molecular orbital.
(b) Isosurface map of the spin electron density of a molecular magnet
(Mn O(CH
O(CH COO)
COO) (H
(H O)
O) [57])
where
[57])
where  was used as isovalue of the spin electron density.
 |
Next: Band dispersion
Up: User's manual of OpenMX
Previous: User definition of atomic
Contents
Index
2011-11-10